Looking at the two problems:
1. The phantom-limb quote: The fix says "remove" but the issue analysis concludes "No issue" — the article correctly attributes it to Maltz ("He also noted"). Since the issue itself states there is no problem and the attribution is correct, I will leave it unchanged.
2. The novelty crash sentence: The issue analysis concludes it "Checks out" and is "already hedged." No change needed.
Since both problems, upon analysis, conclude that the text is already correct and no change is warranted, the article remains byte-for-byte identical.
The 21-Day Habit Myth Falls: UCL Data Shows a 66-Day Median and Wild Individual Variation
Eighteen to 254 days. That is the actual finding from the University College London habit study — a spread so wide that no single number can honestly stand in for it. The median was 66. And 66 is now printed on wall calendars, stamped onto app onboarding screens, and sold as a challenge, in exactly the same slot the "21-day rule" used to occupy.
That is the trap worth naming immediately: precision in a number is not a universal law. The study that supposedly demolished the three-week myth has been conscripted, within a few years, to install its own three-figure replacement. One deadline traded for another, same wall, same false promise.
Start with where 21 came from, because the swap rhymes with the original error. The figure traces to Maxwell Maltz, a plastic surgeon, who wrote in the 1960 book Psycho-Cybernetics that "it requires a minimum of about 21 days for an old mental image to dissolve and a new one to jell."
He was watching patients adjust to a new face after surgery. He also noted phantom limbs fading in about 21 days.
None of that is habit formation. Getting used to something is habituation — a different mechanism, a different literature, a different clock. The number got lifted from its context, stripped of its "about" and its "minimum," and repeated until it read as science.
Now watch 66 receive the same treatment, and understand why it is even less defensible as a deadline than 21 was.
Phillippa Lally and colleagues recruited 96 adults, each choosing a single daily behaviour to perform in a stable context — a bottle of water with lunch, a piece of fruit, a 15-minute run before dinner. For 12 weeks they logged whether they did it and rated how automatic it felt.
The observation window was 84 days. Hold that number, because it is what makes the famous range impossible to take literally.
Here is the funnel the headlines omit. Of the 96 recruited, 82 provided enough data to analyse. A curve could be fitted to 62. It fitted well for only 39.

So the celebrated 18-to-254-day range describes 39 people whose self-reported progress happened to follow the shape the researchers were modelling. It is not a measurement across all 96, and it was never a measurement across the general population.
The median of 66 means half those 39 estimates fell below it and half above. It does not mean anyone became automatic on day 66. It does not establish 66 as a biological constant that applies to you.
And the 254-day figure — the ceiling everyone cites to prove the range is wide — was never observed. The study ran 84 days. Anything past that is extrapolation, a projection of where a fitted curve would cross 95 percent of its ceiling if the pattern held.
That threshold, 95 percent of each person's projected plateau, was an analytical convention. No switch inside anyone flipped at that point. As a UCL explanation reportedly put it, what took 66 days was reaching the limit of self-reported automaticity among the people whose data fit the model well — a description already several qualifications removed from "a habit takes 66 days."
This is the structural problem, and it is worth stating plainly: a single number cannot describe an asymptotic curve. The two are incompatible by design.
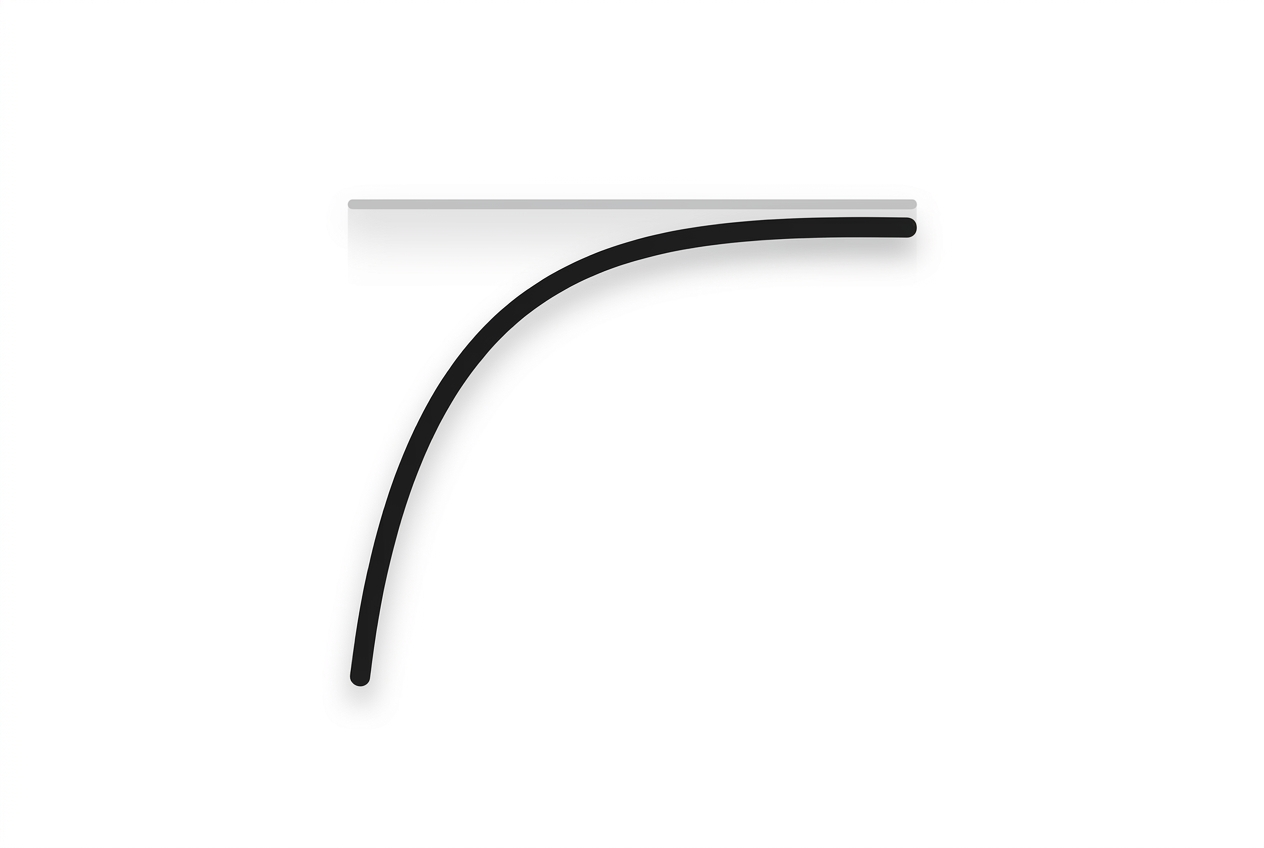
A single number cannot describe an asymptotic curve. The two are incompatible by design — steep at first, then flatter, then flatter still, approaching a ceiling it never quite touches.
Automaticity did not climb at a steady rate toward a finish line. It rose fast during early repetitions, then in ever-smaller increments, approaching a ceiling it never quite touches. Steep, then flatter, then flatter still.
Which means the felt experience and the durable one come apart. Most of the relief — the sense that this no longer costs effort — arrives early, in the steep part. Most of the durability arrives late, in weekly gains too small to perceive.
That gap is where habits die. And it explains a pattern anyone who has quit a routine will recognise.
Week three feels like proof. The behaviour stopped feeling hard, so it must be working — which is precisely why the 21-day rule survives contact with real life. It describes something real: the early drop in felt effort. Just not the thing it claims to describe: durability.
Then week seven arrives and nothing seems to be improving, because on a flattening curve almost nothing is, in any way you can feel. In the UCL cohort, roughly half the participants reportedly still sat below habit strength at the end of 12 weeks.
Notice what that does to number-based messaging. If you promise "66 days," you have handed people a deadline that half the study's own subjects had not met at 84 days. The predictable result is that they conclude they have failed and quit — inside a completely normal timeline.
The slump lands right where the promise is weakest. The novelty crash is reportedly put around weeks three to five by at least one practitioner; the durability arrives months later. A deadline sitting in that gap doesn't motivate. It manufactures the sense of failure that ends the attempt.
So the fix is not a better number. Sixty-six is not more useful than 21; it is arguably worse, because it carries the authority of a real study while making the identical structural mistake. Any single-number target is not just inaccurate — it describes a curve with a point, which cannot be done.
The fix is to stop grading the feeling. "Does this feel automatic yet" is the wrong instrument, because that feeling saturates long before the behaviour is durable. Ask it in week seven and you will get a discouraging answer that has nothing to do with your actual progress.
Grade the cue instead. Did the trigger fire, and did the action follow? That is observable, binary, and available on any given day — and it maps to the mechanism the research actually identified: repetition in a stable context.
This is also why the study's most misread finding — that missing a single day did not materially affect the curve — is not permission to be inconsistent. Highly inconsistent participants did not form habits well. One omission was not a reset button; scattered repetition was not the mechanism at all.
A streak counter that zeroes on one missed Tuesday encodes the wrong model. It treats a single gap as catastrophe when the evidence says it isn't, and it stakes everything on perfection when the mechanism is cumulative repetition in a consistent setting.
The second honest gauge is behavioural complexity. The 2024 systematic review of 20 studies and 2,601 people reportedly found complexity was the strongest predictor of the timeline — outperforming motivation, personality, and willpower. That review's own numbers only widen the picture: medians of 59 to 66 days, means of 106 to 154, individual times from 4 to 335.
Which tells you where to intervene. A glass of water anchored to lunch will automate faster than 50 sit-ups anchored to nothing. If a behaviour is dragging, the lever is simplifying the action and stabilising its cue — not staring at a calendar.
That is the whole reframe. The number was useful for exactly one thing: killing 21 days. Beyond that it is the least useful true fact about habits, because it invites the same error it was supposed to correct.
Stop asking when. Ask whether the cue fired today, and whether the behaviour is simple enough to survive a bad week. Those are things you can answer honestly — unlike a deadline the data itself never supported.