"A PM using Figma Make was nearly as efficient as a designer who wasn't."
That sentence is buried in the fine print of Figma's new study, and it is the most important thing the company published this year — more important than the 20% headline it sits underneath.
Let me start where most critiques of vendor research can't: this study is real.
Last week we looked at teams instrumenting their own gate-rejection rates — building internal evidence about where AI-assisted work fails review. This week the evidence comes from the vendor itself.
Figma's Data Science team, and lead Data Scientist Remy Stewart, did the thing almost nobody in this market does. They ran a randomized controlled trial. One hundred participants — 50 product designers, 50 PMs — working identical tasks, half with Figma Make and half without, moderators following a standardized script.
More telling is what they rejected. They explicitly turned down online A/B testing, because it can't control which specific tasks each user does, so task complexity leaks in as a confounder.
They turned down propensity score matching, because it assumes every confounder is captured in the logs — and an anonymized user ID tells you nothing about someone's design experience.
They turned down instrumental variables, because there's no valid instrument in the data: nothing nudges a user toward AI for reasons unrelated to their skill or their task.
Then they set the sample size with a power analysis reportedly pegged to the GitHub Copilot RCTs — the closest thing this field has to a canonical productivity study.
This is not vaporware math. This is the rare vendor claim built to be falsifiable, and the person who framed it publicly, Figma's head of data Evan Welbourne, reportedly said as much: "Nearly every claim about AI's productivity impact is unfalsifiable." His own study, on his framing, was designed not to be. Credit where due.
So the critique that follows is not that the study is junk. It's that a study this good deserves to be held to the standard it almost meets — and by that standard, the independence problems are disqualifying.
Figma tested Figma. It picked Make, "because of its popularity with Figma users" — which the company describes as being among its most-used AI features. It authored the tasks. It moderated the trial. And it reportedly published around the time Make exited beta and went generally available, though the evidence does not establish that timing relationship.
Every one of those is a choice a credible benchmark must not make. Task authorship, moderation, tool selection, and release timing are precisely the levers that let a vendor shape a result without ever touching the data. You don't have to allege manipulation. Structurally, the conditions for it are all present.
There is no single participant, and no single task, for which '20% faster' is a real experienced number. It's a statistical composite of two disjoint effects.
But the sharpest problem isn't independence. It's that Figma's own numbers refuse to support Figma's own headline.
"Design work got 20% faster and 16% easier," the blog says. The clean number. The one that will end up in the sales deck.
Now disaggregate it, using the company's own disclosure. PMs gained more than designers: 23% faster and 37% easier, against the 20% and 16% overall. The average is being pulled up by the non-designers.
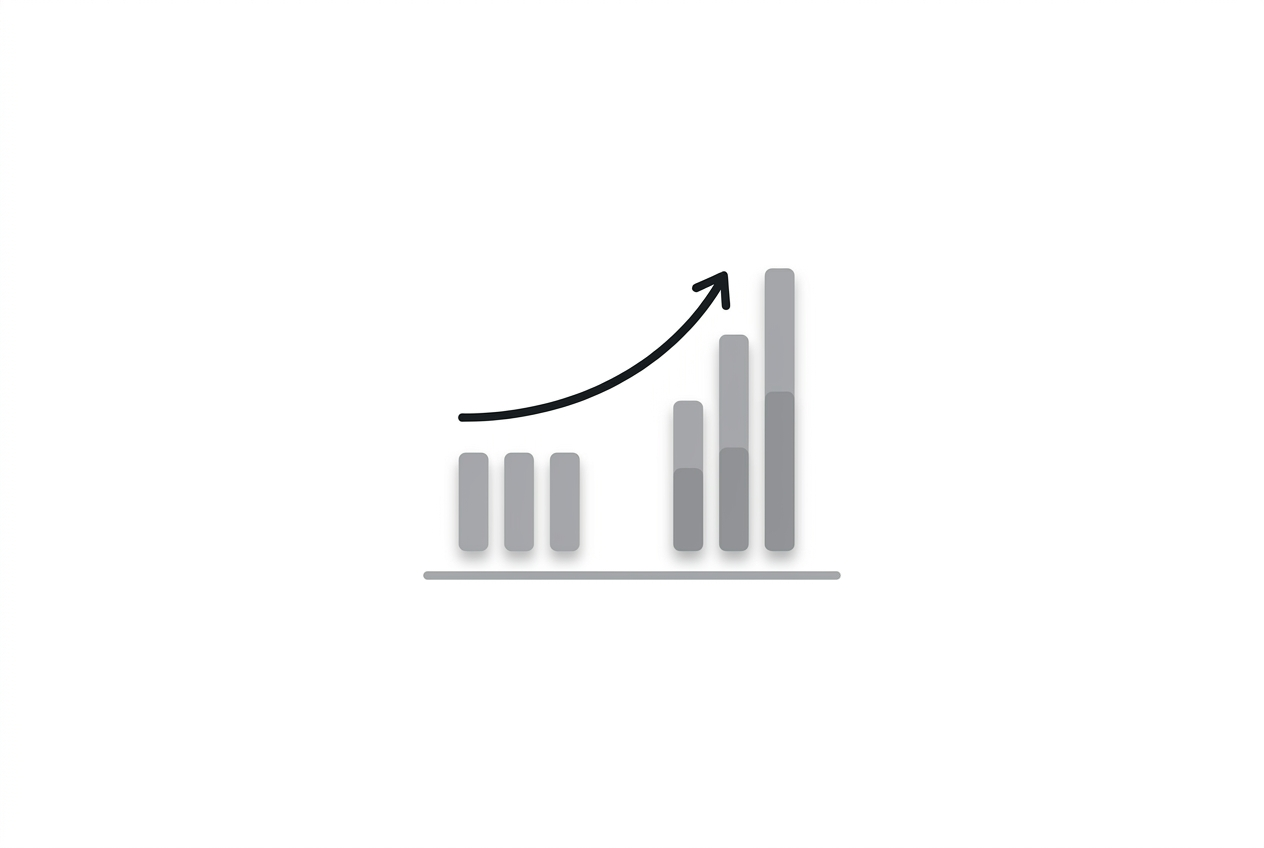
And the gains don't overlap. Read that again, because it dismantles the headline. PMs got faster on the two simplest tasks and reportedly showed no significant gain on the hardest. Designers got faster only on the hardest.
So the "20%" is not a coherent measurement of one population getting faster at one kind of work. It's an average smeared across two non-overlapping groups doing different tasks — designers speeding up where PMs couldn't, PMs speeding up where designers had less room to.
There is no single participant, and no single task, for which "20% faster" is a real experienced number. It's a statistical composite of two disjoint effects.
Which brings us back to the buried sentence, which appears in Welbourne's LinkedIn post: "A PM using Figma Make was nearly as efficient as a designer who wasn't."
That is not a productivity finding. That is a redistribution finding.
The story Figma's data actually tells is not that designers got 20% faster. It's that Make closes the gap between a PM and a designer on design work — that it lets people who aren't designers produce design output at nearly designer speed.
This is entirely consistent with everything else Figma has said about Make. Their own First Round interview reportedly described Make as blurring "the line between design and production, reducing the technical skills required to actually bring a product to life." Figma's blog post noted the team "already knew from user research that Make has opened the door to design for PMs."
The door-opening is the product. The speedup is a side effect — and on the honest read, the speedup mostly accrues to the people walking through that newly opened door, not to the designers who were already inside.
"20% faster" frames Make as a tool that accelerates designers. The disaggregated data frames it as a tool that lets PMs do design work. Those are different products, with different consequences for how teams staff, and who gets to make.
Why does the headline choose the first framing? Because "your designers will be 20% faster" is a productivity pitch every design leader knows how to buy. "Your PMs can now do design at nearly designer speed" is a restructuring pitch, and restructuring pitches make the people currently in those roles nervous.
So what would a credible benchmark actually require — the thing this study gestures toward but, as a vendor artifact, can't be?
Neutral task authorship, by someone with no stake in which tool wins. Blind moderation, so the people running the trial don't know or don't care which condition they're facilitating.
Role-stratified reporting as the headline, not the footnote — because we now have proof that a blended average hides the entire story. If designers and PMs get faster on non-overlapping tasks, a single number is not a summary, it's a smear.
And tools tested against each other, not against nothing. Every number Figma published compares Make to no-Make. That measures whether a tool beats its own absence — a bar so low it's nearly impossible to fail. It tells you nothing about whether Make beats a competitor, or beats a designer's existing workflow with a different assistant.
That last gap matters most, because Figma has a pattern here. The Dev Mode ROI figure came from a Forrester study Figma commissioned. The Code Connect numbers — 19.6% faster, 29.5% fewer tokens — reportedly came from Figma's own evals. The Findable case study reportedly leads with "50% faster," a single-customer anecdote with no control at all.
The Make RCT is by far the most rigorous of these. But it lives in the same genre: vendor measures vendor, against vendor's own baseline, and reports the number that sells.
The measurement thread we've been tracking — teams instrumenting their own gate-rejection rates — exists precisely because internal, task-specific evidence is the only thing that survives this vendor pattern. When the vendor's own RCT can't be independent, you have to build your own.
Here is the reframe. Stop reading Figma's study as a speed claim. It's the best-measured evidence yet for a labor claim — that AI design tools are less about making designers faster and more about widening who counts as a designer.
That's a bigger story than 20%. It's the one a real cross-vendor benchmark would be forced to put in the headline. Figma, understandably, put it in the fine print — one sentence, about a PM who was nearly as fast as a designer, doing a designer's job.